Interacting with your Data
Use natural language to query your data and create beautiful visualizations that tell your story
Guides
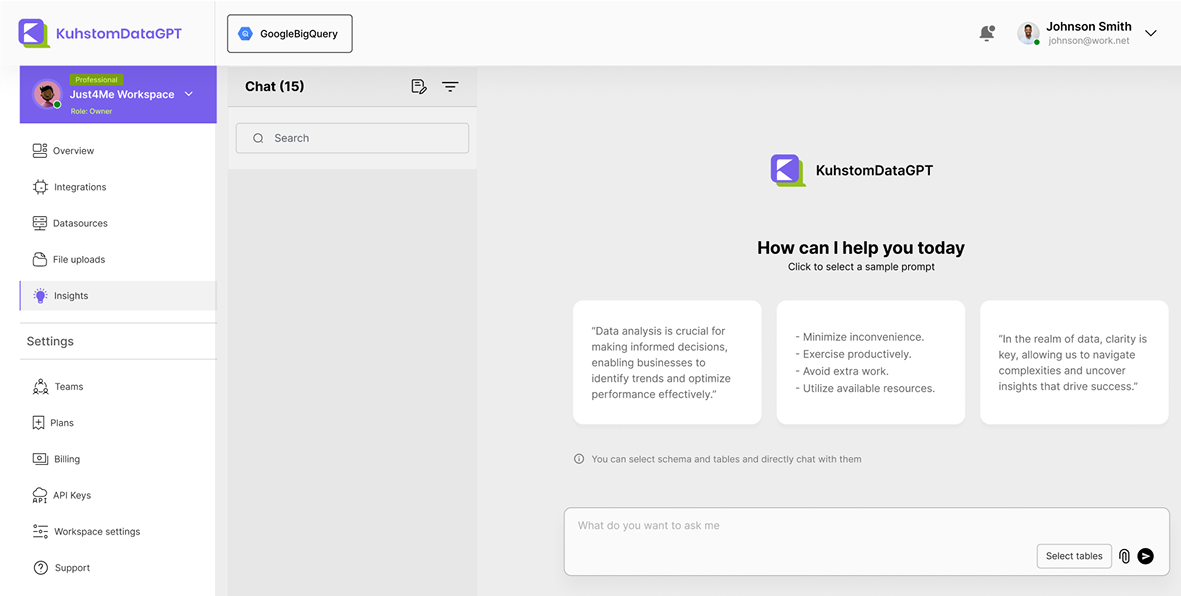
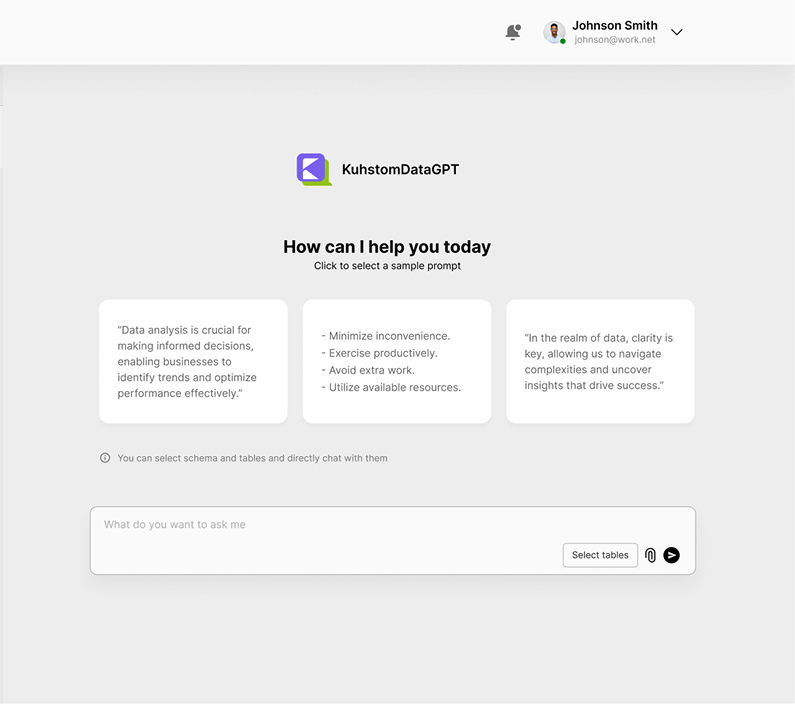
AI-Powered Analytics
Ask questions in plain English and get instant
insights from your data
- Natural language processing
- Interactive visualizations
- Real-time data analysis
- Contextual AI responses
1
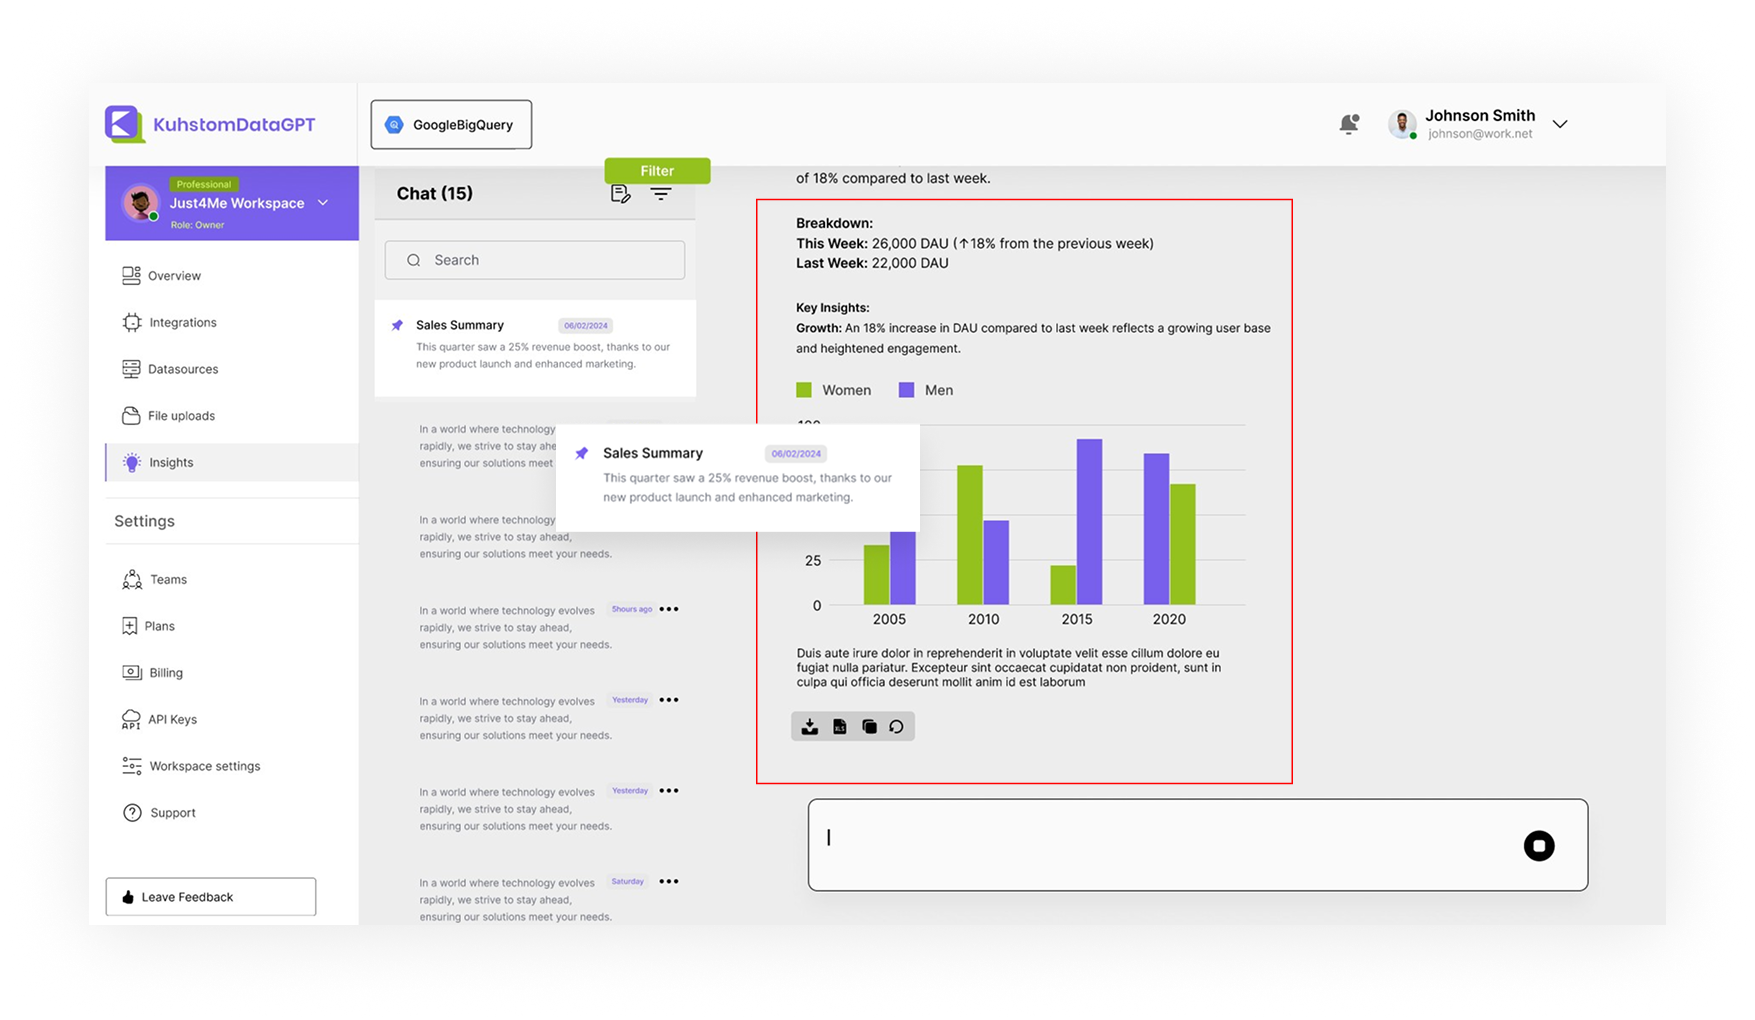
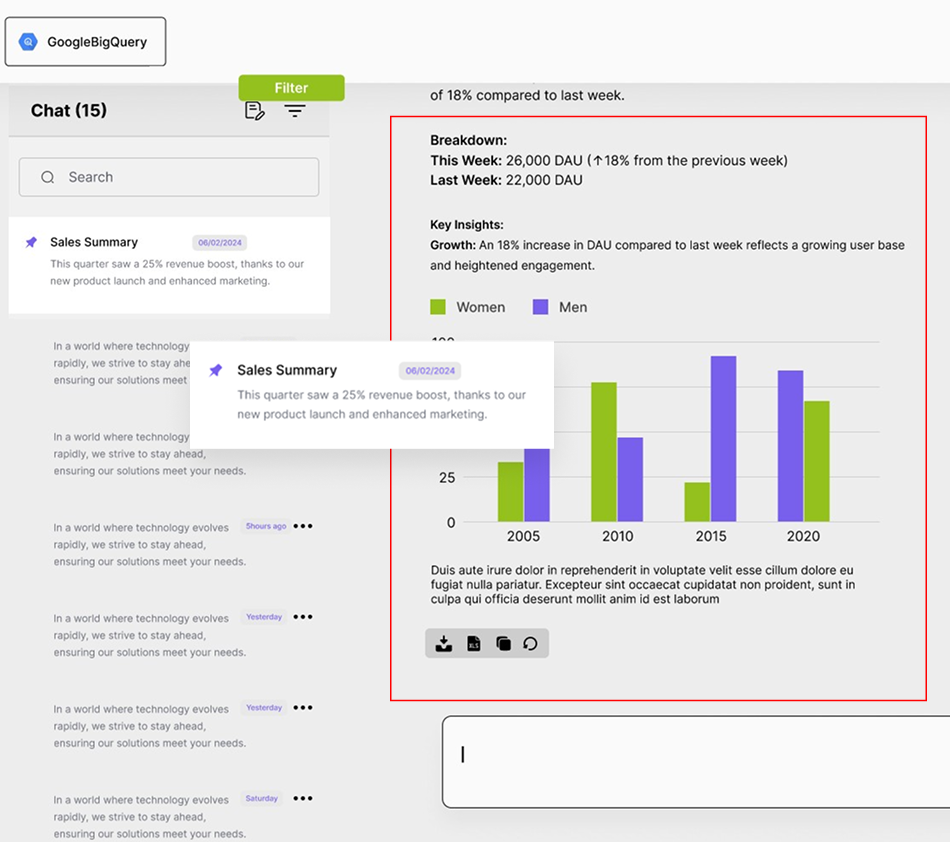
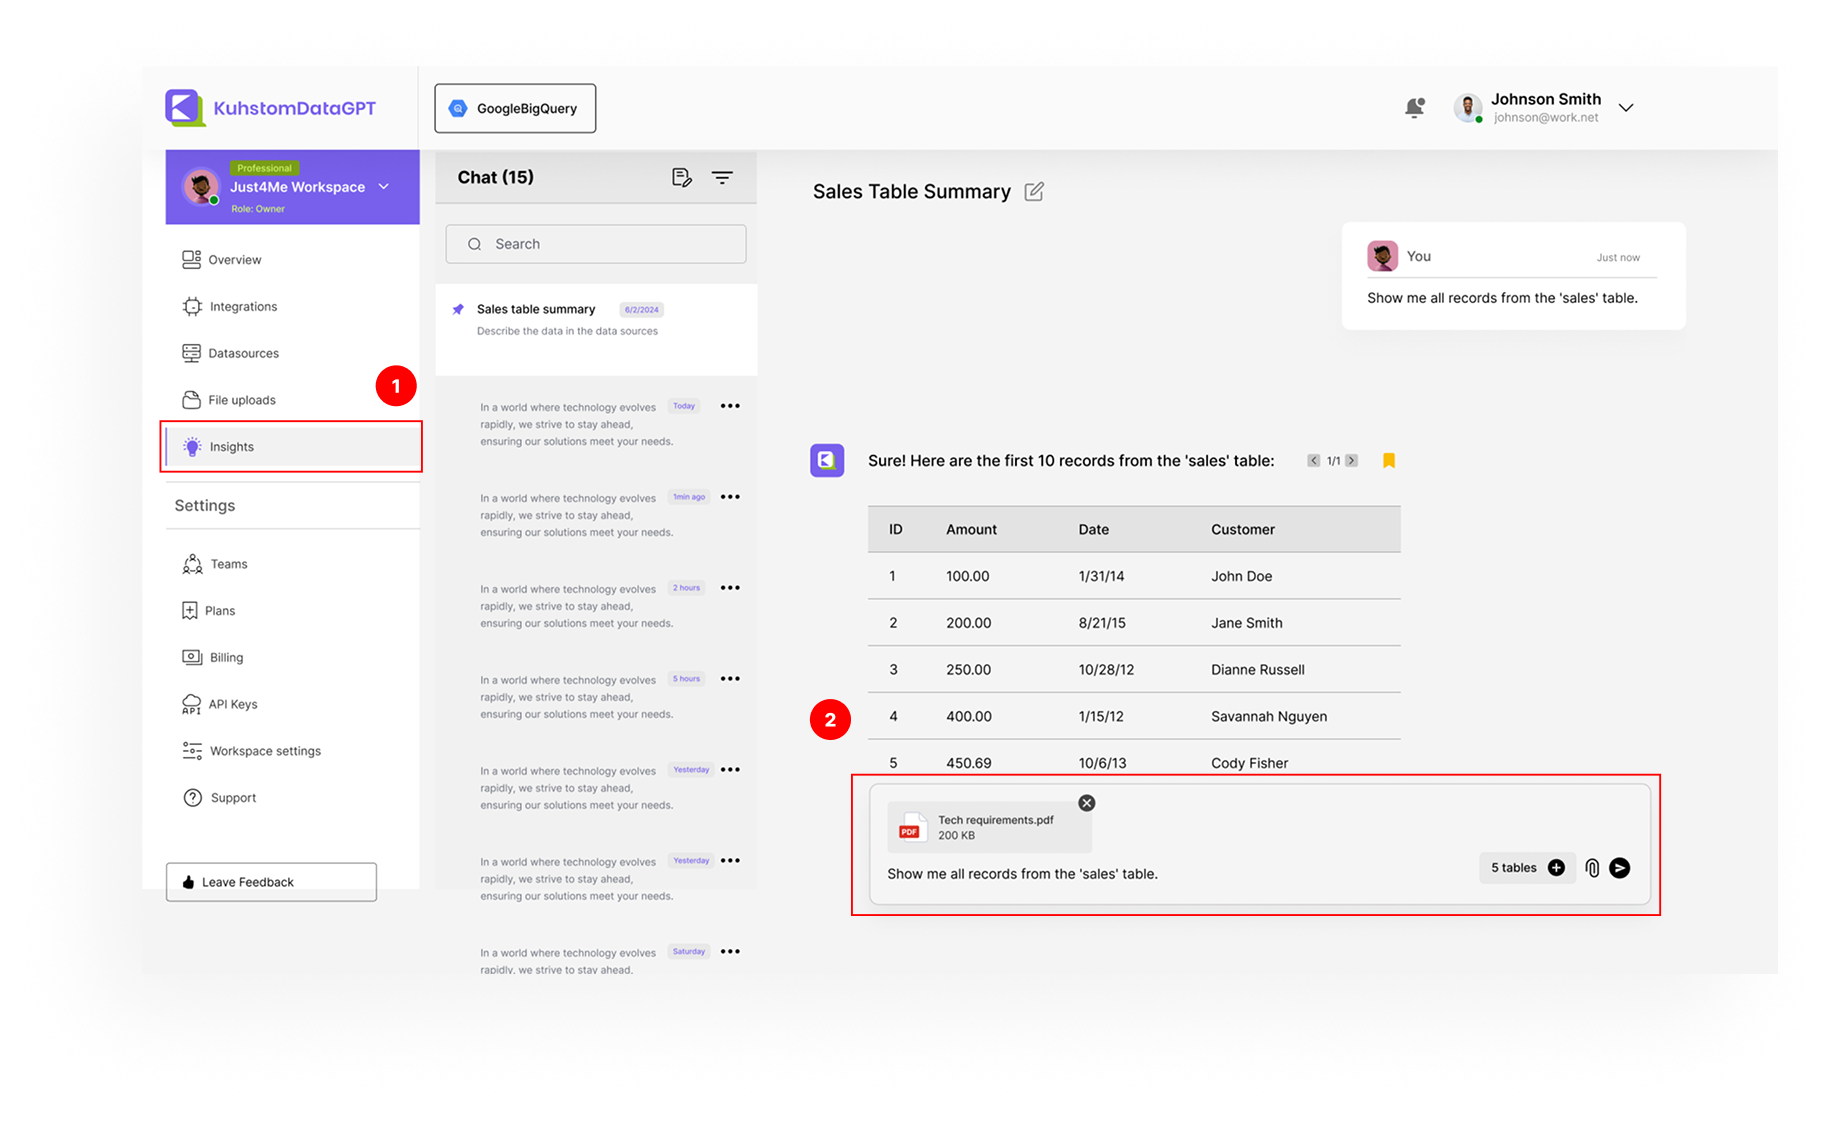
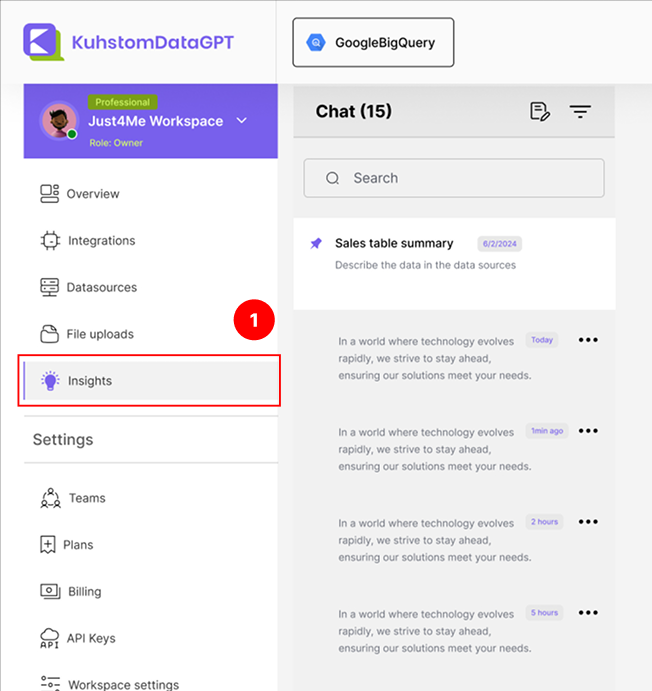
Use Conversational AI Interface- Within your dashboard, open the AI chat feature
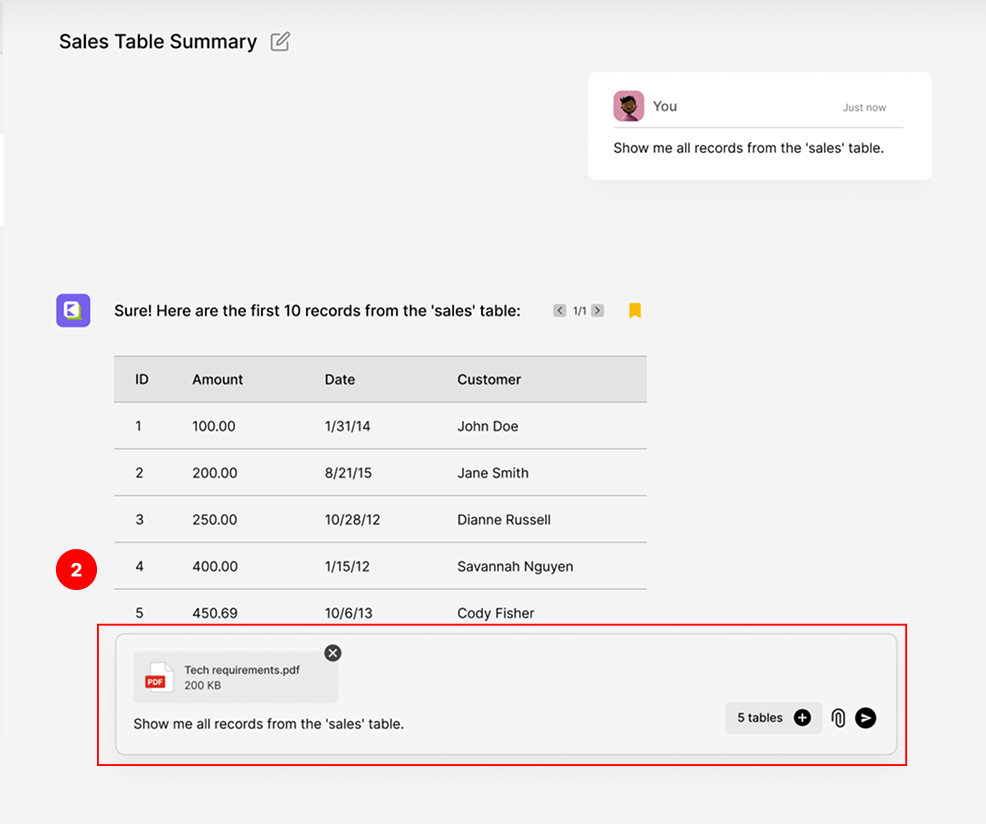
- Type your question or request in natural language in the
chat box. Queries like, ‘What were the sales figures for Q1? - The AI will process your question and provide relevant data
insights
2
Visualize Your Data- Transform your data into interactive charts and dashboards
- Choose from various visualization options (Bar charts, Line
graphs, heatmaps) - Share your visualizations with team members and
stakeholders